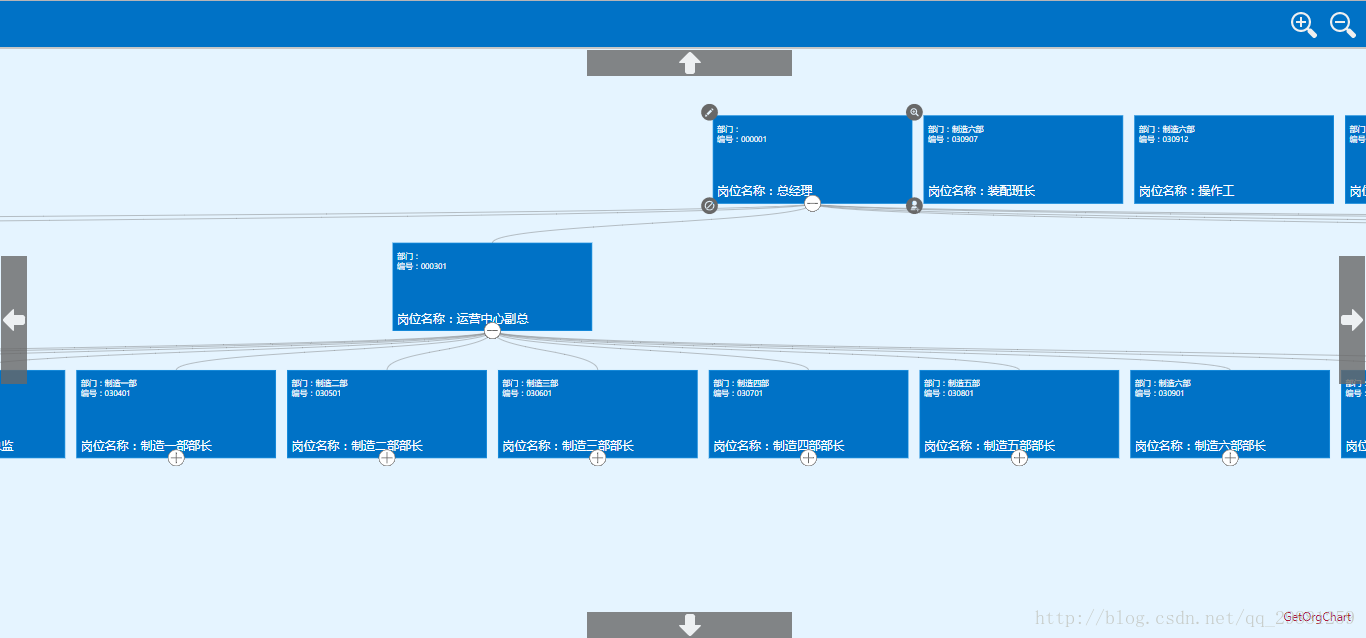
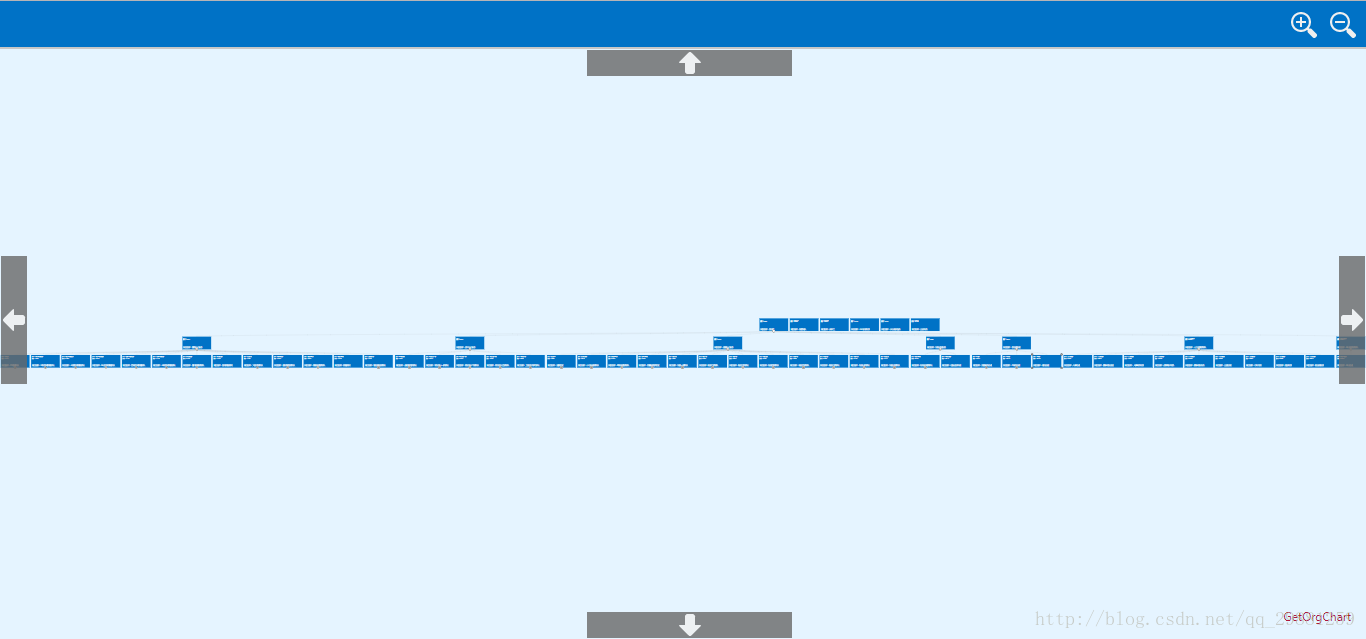
今天做公司项目时,需要实现一个树形关系的组织架构图,网上查了一些资料,发现GetOrgChart框架(感兴趣可以研究研究)很好的实现了这一需求,于是用到了项目中,下面先上一个成果图。


如图所示,岗位关系是一个树形关系,可以随意改变架构图大小,感觉挺不错,下面开始讲讲具体怎么做的。
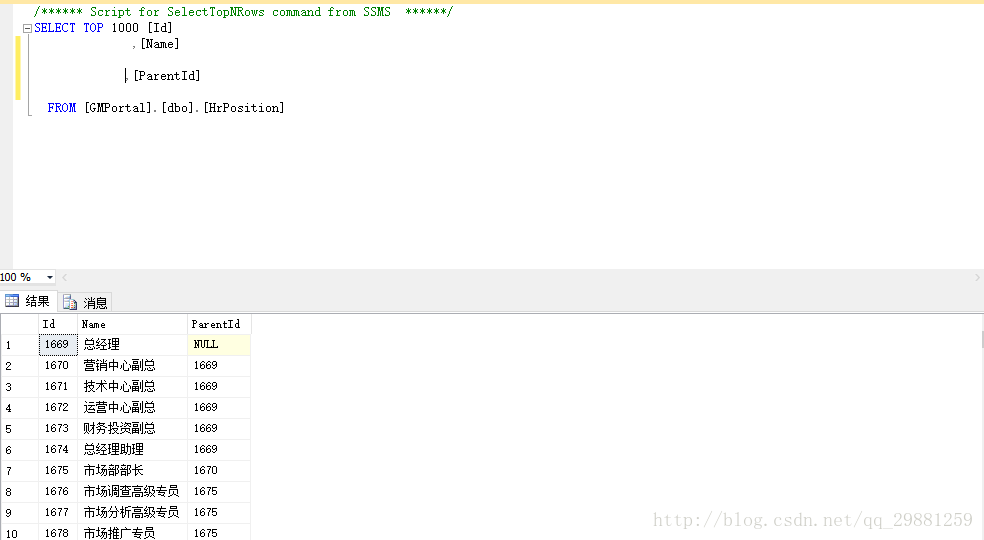
数据库设计结构:

View视图
@{
    ViewBag.title = "PositionChart.cshtml";
    Layout = null;
}
<!DOCTYPE html>
<html>
<head>
    <title>OrgChart | Performance 2000 nodes</title>
    <meta name="viewport" content="width=device-width, initial-scale=1, maximum-scale=1">
    <script src="~/js/jquery-1.11.0.min.js"></script>
    <script src="~/getorgchart/getorgchart.js"></script>
    <link href="~/getorgchart/getorgchart.css" rel="stylesheet" />


    <style type="text/css">
        html, body {
            margin: 0px;
            padding: 0px;
            width: 100%;
            height: 100%;
            overflow: hidden;
        }

        #people {
            width: 100%;
            height: 100%;
        }
    </style>
</head>
<body>
    <div id="people"></div>

    <script type="text/javascript">
        var source = [];

          $(function () {
            $.ajax({
                type: "Get",
                url: "@Url.Action("GetPositionChart", "Staff")",

                success: function (data) {

                    var orgChart = new getOrgChart(document.getElementById("people"), {
                        theme: "annabel",
                        linkType: "B",
                        primaryFields:        ["PositionName","DeptName", "code"],
                        photoFields: ["image"],
                        gridView: true,
                        enableSearch: false,
                        dataSource: data
                    });
                }
            });
        })

    </script>
</body>
</html>
Controller
        public ActionResult PositionChart()
        {
            return View();
        }
        public ActionResult GetPositionChart()
        {
            var data = hrmContext.Position.Where(m => true);
            var jsdata = data.Select(p => new
            {
                id = p.ID,
                parentId = p.ParentId,
                DeptName = "部门:"+p.Dept.Name,
                PositionName="岗位名称:"+ p.Name,
                code="编号:"+ p.Code

            }).ToList();

            return Json(jsdata, JsonRequestBehavior.AllowGet);
        }
应该很清楚了吧,需要用到的两个getorgchart.js和getorgchart.css可以去官网下载(http://www.getorgchart.com),有什么建议或不懂可以告诉我,一起学习进步.


评论区